Addendum (August 24): Don’t read this now. The article it was taken from has been deleted from their website. Here’s the note from the author:
by Colleen Huber, NMD
8/15/20 update from Dr. Huber:
“Unfortunately, I have to remove this [the article] paper for now.
Some diligent and astute researchers who read my paper have now directed me to data and pages on the CDC website that I had not previously seen, which will likely adjust numbers that I published.
My paper may have to be revised, and my revised paper will appear here when ready. Please know that many researchers are sorting through the data now, and will possibly post their information before mine is figured out. Thank you for your patience and continued interest in this topic.”
Visit for the original link and updated article when posted: https://www.primarydoctor.org/is-there-a-pandemic
So check tomorrow or later for more. The veracity of this article is important, for a couple reasons at least.
The following is an analysis by greenmedinfo.com and is the best ‘Proof of Fraud’ re the COVID-19 ‘pandemic’ that I’ve come across. These numbers do not lie (I’ve put in bold the the bullet points):
From CDC data, 2020 has the lowest weekly death rate in a decade – so far
Although some of this lower death rate may be due to reporting lag, that lag is likely too small to explain the lower weekly death rate in 2020 than in previous years.
Abstract
A pandemic that commands the attention of the public, and action by the medical field, is one that sickens many people, overwhelms healthcare resources, and raises the total death rate above that of a typical year or season. The COVID-19 era that began in early 2020 has received much attention in the United States for deaths that have occurred during this time. Has COVID-19 resulted in more deaths (known as “excess deaths”) than would have happened in a typical year? An obstacle to answering that question is that testing for COVID-19 is flawed from being both inaccurate and imprecise, for reasons discussed herein, and it is difficult to distinguish COVID-19 from other respiratory illnesses, due to symptoms and signs that are mostly indistinguishable from the common cold, flu or pneumonia. It is possible that flu and pneumonia deaths, and perhaps others, have been ascribed to COVID-19, especially due to peculiarities in mortality reporting discussed below.
Therefore, year-over-year comparison of deaths from all causes is likely the best analysis of available evidence of whether the United States is now confronted by a deadly pandemic.
However, only 32 weeks have elapsed in 2020. For each previous year, 52 weeks have already elapsed. How then can we compare deaths from all causes in 2020 to previous years? In this paper, I divide total deaths by number of weeks to arrive at number of deaths per week for each of the last 21 years, January 1, 2000 through August 8, 2020.
The US Centers for Disease Control (CDC) lists total deaths for many previous years. The CDC also provides number of deaths from all causes in 2020. On examination of the data for the first two decades of the 21st century in this paper, it is seen that the 2020 weekly total death rate in the US is the lowest in a decade, and second lowest in the 21st century so far.
Background
A pandemic is the prevalent spread of a disease over an entire country or worldwide, and there is often increased mortality for its duration compared to more typical years. Early rises in death rate are a warning of an especially dangerous pandemic. In 2020, it has been widely assumed that COVID-19 is a pandemic.
Understanding the COVID-19 phenomenon has been obstructed by several factors.
COVID-19 is assumed to be caused by a coronavirus that is said to be novel, “SARS-CoV-2.” However, SARS is likely a misnomer, because SARS is the acronym for Severe Acute Respiratory Syndrome. It is not at all clear that a majority of COVID-19 positive individuals have had acute respiratory distress with this illness. Other factors, such as use of over-pressurized ventilators, have led to acute respiratory distress among those diagnosed with COVID-19.
The most confusing aspect of COVID-19 is reliance on a reverse transcriptase, polymerase chain reaction manufacturing technique (RT-PCR), now nearly universally re-purposed as a test for the presence of the SARS-CoV-2 virus, although there are many problems with this test. I outline these problems below:
- The very questionable applicability of the RT-PCR manufacturing technique for propagating RNA, now used throughout the world as a presumed test for presence of the particular infectious agent in question, or of other coronaviruses, other virions and virus particles that may resemble the SARS-CoV-2 infectious agent without distinction among those; and
- The 80% false positive rate of nucleic acid testing in the diagnosis of COVID-19; (1) and
- The arbitrary number of iterations of this test that must be selected to produce a positive result; and
- Instructions given to physicians by the CDC to code cases as COVID-19 deaths including presumptively; (2) and
- Controversy regarding higher Medicare and private insurance reimbursement for COVID-19 patients than for flu patients, (3) (4) which may have skewed reported cause of death on death certificates; and
- Financial rewards to hospitals by the CARES Act for the number of COVID-19 patients they treat; and
- Direct financial incentives to patients for positive COVID-19 test results; (5) and
- The possibility that there may be political influences in altering the true number of deaths from COVID-19. [Ya think???]
Therefore, in order to attain the truest picture of the impact of the COVID-19 on public health, it may be helpful to look at deaths from all causes, to see if there was a significant change. Lack of a significant change in those numbers implies lack of lethality from any new cause.
Methods
As of this writing, 32 weeks have elapsed in 2020. However, for each previous year, 52 weeks have already elapsed. How then can we compare deaths from all causes in 2020 to previous years?
I divided the total number of deaths for each year by the number of weeks. That is 52 weeks for all years, except for 2020, in which 32 weeks have elapsed as of this past Saturday, August 8, 2020, which is the most recently updated week in the CDC data cited. This gives us the average number of deaths per week for each of those years, and allows a meaningful comparison between 2020 and prior years.
CDC data provides deaths from all causes for all previous years in the 21st century. (6) (7) The CDC also provides data for all-cause deaths in 2020. (8)
Results
Table 1
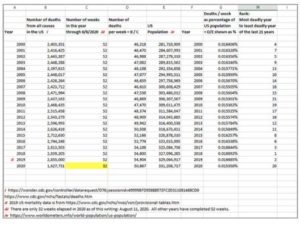
Column D of Table 1 shows the total deaths divided by the number of weeks in the year to obtain an average number of deaths for each week in that particular year. That is calculated for all 21 years (2000 through 2020). 32 weeks for 2020 is highlighted to draw attention to that difference from the other years.
It is important to factor in the growing US population over the last two decades. The US population for each year is given in Column E.
Column G shows the ratio of total weekly deaths per US population for each of the first 21 years of the 21st century.
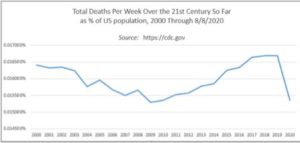
A comparison of the percentages in Column G are best seen in Graph 1 below.
Graph 1
We can see in Graph 1 that all-cause deaths per week in the US population seem to fluctuate between 0.015% and 0.017% of the population throughout the first two decades of this century. However, we see for all of the 21 years, 2020 has the second lowest weekly deaths of any year as a percentage of the total population. In Table 1 of this paper, Column H shows the rank of each year of the last two decades regarding its mortality. Only 2009 had lower mortality. All other years have had higher weekly death rates, as a percentage of population, than 2020. This second lowest death rate, in 2020, compared to previous years, may reflect lag time in reporting of mortality data to the CDC. However, if that is the case, it is likely not attributable to COVID-19 because the CDC has consistently reported for over three months that COVID-19 deaths peaked the week of April 18, 2020 in the US, and have been on a steady decline ever since. That is illustrated in CDC’s Table 1, which is updated each weekday at this link (8) and with screenprint from August 10, 2020 (the first weekday after and reflecting the 32nd week of 2020) below endnote (8).
https://www.cdc.gov/nchs/nvss/vsrr/COVID19/
Also, at the same link, the CDC estimates that at least 75% of all deaths have been reported and tallied within eight weeks. Therefore, there is likely little difference from the currently displayed numbers, and the numbers that will ultimately be displayed. Any adjustment to these numbers is unlikely to change the trajectory of the curve in Graph 1 from its current sharp downward direction, toward an upward surge and a peak in 2020, which would give evidence of a pandemic if that were the case.
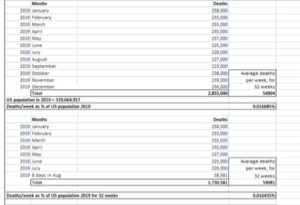
We have an opportunity to compare the first 32 weeks of 2019 with the same period in 2020, using the following monthly breakdown of 2019 in Table 2. When considering only the first 32 weeks of 2019 (as we have so far of 2020), we see that the total deaths per week as a percent of 2019 population is still higher than the comparable 32-week time period of 2020. This data shown below is reported by the CDC (9), and is from https://www.cdc.gov/nchs/nvss/vsrr/provisional-tables.htm
Table 2
 Table 2 shows deaths for each month in 2019. If we consider January through July 2019, plus the first 8 days in August 2019 (derived from the whole month of August / 31 * 8), then we see that total deaths through the first 32 weeks of 2019 were 1,730,581. This averaged 54,081 deaths per week. As a percentage of the 2019 US population (329,064,917), the total weekly death rate in 2019 was 0.016435%, which was still higher than for the first 32 weeks of 2020, which was 0.015358%. It was 7% higher in 2019 than in 2020.
One might wonder if the 32 weeks of 2020 have been truly representative of what the entire year will be. According to this CDC graph, (10) it seems as if the early months of a year are generally more deadly than later in a year. January through May seem to contain a disproportionate number of deaths in a year compared to June through December.
Therefore, let’s consider CDC mortality data January through May 2020. On May 29, 2020, the last weekday in May, the CDC reported total deaths of 984,553 (11) to date in the US. This was at nearly the end of week 22. Dividing, we find 44,752 deaths per week. Dividing that number in turn by the 2020 US population, we have 44,752 / 331,208,757. The result is 0.01351% of Americans died per week in those first 5 months of 2020. This percentage is even lower than the weekly death rate computed using data through August 8, 2020, and it is still lower than the weekly death rate for any of the prior years in the 21st century, bar none. [This is as close to ‘Proof of Fraud’ as you can get!]
Discussion
If COVID-19 is genuinely the deadly pandemic that it is widely thought to be, then total deaths would not only be a little higher than usual, but would be much greater during the period of its peak incidence and closely following weeks. It is not possible to have a deadly pandemic rage through a population without increasing the total number of all-cause deaths during the year of its peak incidence, because there is no reason for alternate causes of death, (heart disease, cancer, etc) to simultaneously decline. Therefore, if deaths are not significantly increased above previous years for a given region, then there has been no pandemic, nor even an epidemic there.
On the contrary, what has been found is that so far there are fewer deaths per week in 2020, than in any other year since 2009. Although some of this lower death rate may be due to reporting lag, that lag is likely too small to explain the considerably lower weekly death rate in 2020 than in previous years.
It seems that there is no pandemic in 2020 of COVID-19 or of anything else, at least not in the United States.
Note: This is a live stream video by Sayer Ji (from greenmedifno.com). It’s worth a look and a subscription.
References
- G Zhuang, M Shen, et al. Potential false-positive rate among the ‘asymptomatic infected individuals’ in close contacts of COVID-19 patients. https://www.researchgate.net/publication/339770271_Potential_false-positive_rate_among_the_%27asymptomatic_infected_individuals%27_in_close_contacts_of_COVID-19_patients
- US Health and Human Services, NVSS. Vital statistics reporting guidance. Apr 3, 2020 https://www.scribd.com/document/455607875/US-HHS-Document-to-Doctors-on-How-to-Certify-COVID-19-Deaths-including-Related-Deaths?campaign=VigLink&ad_group=xxc1xx&source=hp_affiliate&medium=affiliate
- M Rogers. Fact check: Hospitals get paid more if patients listed as COVID-19, on ventilators. USA Today. Apr 24, 2020. https://www.usatoday.com/story/news/factcheck/2020/04/24/fact-check-medicare-hospitals-paid-more-covid-19-patients-coronavirus/3000638001/
- American Hospital Association. Senate passes the Coronavirus Aid, Relief, and Economic Security (CARES) Act. https://www.aha.org/special-bulletin/2020-03-26-senate-passes-coronavirus-aid-relief-and-economic-security-cares-act
- J Crump. California county will pay people diagnosed with coronavirus $1250 to stay home. Independent UK. Aug 7, 2020. https://www.independent.co.uk/news/world/americas/coronavirus-california-alameda-county-stipend-stay-home-a9660536.html
- Centers for Disease Control and Prevention. Underlying Cause of Death, 1999 – 2018 Request. https://wonder.cdc.gov/controller/datarequest/D76;jsessionid=49999BFD95688972FC2D311081468CD0
- Centers for Disease Control and Prevention. Deaths and Mortality. National Center for Health Statistics. https://www.cdc.gov/nchs/fastats/deaths.htm


75 comments for “Proof of Fraud”